The Anatomy of a Perfect Dashboard
Dense data, simple choices, zero noise. A practical guide to dashboard design that operators actually use every day.
Denkinger Bros
Co-Founders
March 22, 2026
9 min read
On this page
Most dashboards are landing pages with charts. The ones that get used 40 times a day look completely different.
Here's the anatomy of a dashboard built for the operator who lives in it — not for the demo.
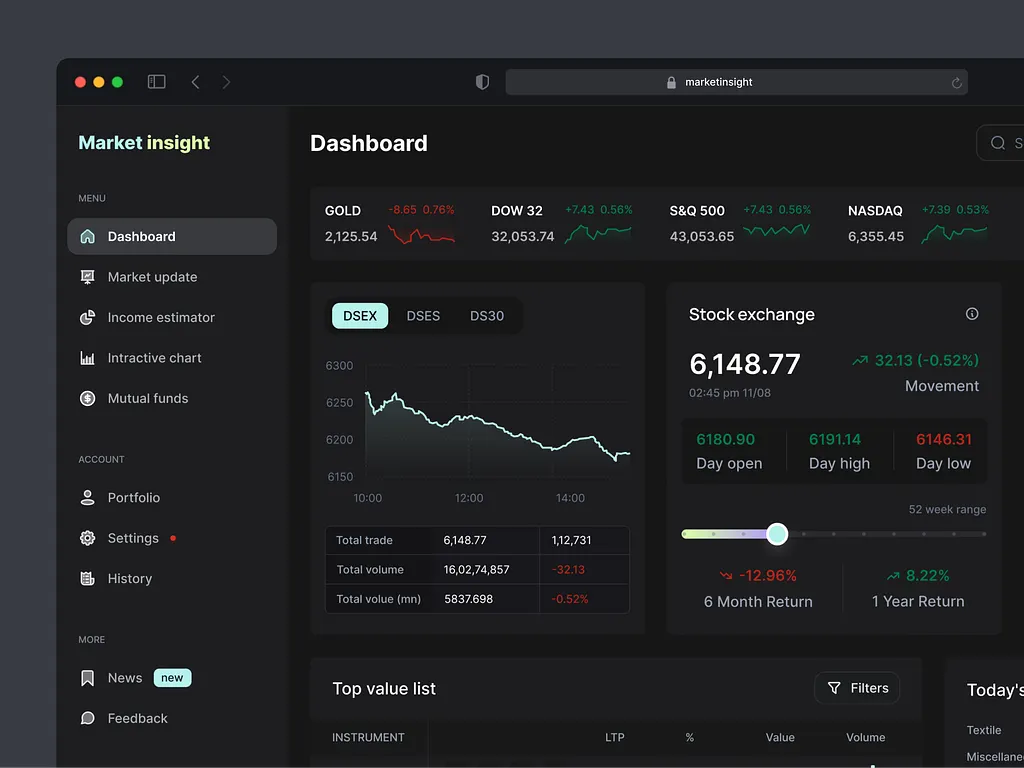
Density is a feature
The first instinct of most designers is to add white space. The first instinct of a power user is to ask why they have to scroll.
Power-user dashboards are dense:
- Tighter line heights (1.3-1.4 instead of 1.6)
- Smaller text sizes for tabular data (12-13px is fine)
- Compact card padding (16-20px instead of 32-40px)
- More information per screen, fewer screens to navigate
Density isn't visual chaos — it's information designed for the user who already knows what they're looking at.
One primary action per surface
Dashboards die when every card has its own action. The eye doesn't know where to land.
The fix: pick the one action a user is most likely to take on this surface, give it the strongest visual weight, and let everything else be secondary.
For a sales dashboard: "Log activity." For a content tool: "Create new post." For an ops dashboard: "Acknowledge alert." Everything else fades back.
Charts that earn their place
Every chart on a dashboard should answer a question the user actually asks. If you can't articulate the question, kill the chart.
Common questions worth answering with a chart:
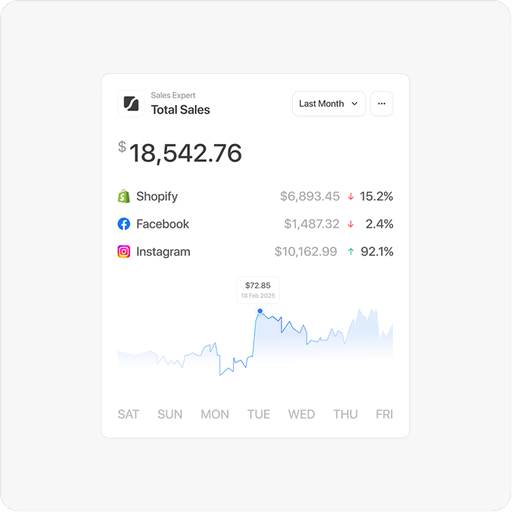
- "Is this trending up or down?" → Sparkline, no axes
- "What's the breakdown across categories?" → Horizontal bar with sorted values
- "Where are we vs. goal?" → Progress bar with anchor at goal
- "Has anything changed recently?" → Last-7-days delta with arrow
Common questions not worth a chart:
- "What's the exact value?" → Just show the number
- "How does this compare to industry?" → Show the benchmark inline, not a separate chart
Saved views as the killer feature
Power users don't browse — they configure. The single feature that turns a dashboard from "tool" to "extension of brain": saved views.
Filter by territory, save it. Group by stage, save it. Show only deals over $50K, save it. Now the user opens the dashboard once and switches between three saved views all day.
Implementation matters: saved views should be one keystroke away (Cmd+1, Cmd+2, Cmd+3) and should sync across devices.
Empty states do real work
Most empty states are afterthoughts: "No data yet." Wasted real estate.
A great empty state teaches the user what the surface is for. It shows a screenshot of what the populated state looks like, names the action that fills it, and links to the docs that explain it.
The dashboard's empty state is part of onboarding, even for users who've been on the product for a year — because new sections always start empty.
Keyboard everything
If your power users can't drive the entire dashboard from the keyboard, you've capped their speed.
Minimum keyboard surface area:
- Cmd+K to open command palette
- J/K to move between rows
- Enter to open selected item
- E to edit, Cmd+S to save, Esc to close
- Number keys for tab switching
Once you've shipped this, your fastest users will move 3x faster than your average user. They'll also become your most loyal customers.
Mobile is read-only
Every dashboard needs a mobile view. Most don't need to be fully editable on mobile.
The right mobile dashboard is a glance: top-line metrics, today's actions, alerts. If the user needs to do real work, they open the laptop. Designing for read-only mobile is half the surface area and twice the polish.
What to cut
The things we cut from almost every dashboard we redesign:
- Welcome banners on the home view (annoying after day 2)
- "Helpful tips" tooltips that pop up unprompted
- Animation on metric changes (visual noise, no signal)
- "What's new" feeds that no one reads
- Three-tier color systems for status (green/yellow/red is enough — the rest is decoration)
The takeaway
Build for the operator who'll use this 40 times today. Not the buyer who'll see it in a demo, and not the designer who'll screenshot it for Dribbble.
Density, saved views, keyboard shortcuts, ruthless cutting. That's the dashboard people don't close.
Building a dashboard? Book a strategy call — we'll show you the exact patterns we use to design the ones that get opened every morning.
Topics
Denkinger Bros
Co-Founders
Share
Continue Reading
Ready to Build?
Book a free strategy call and let's map out your project, tech stack, and launch timeline — zero obligations.